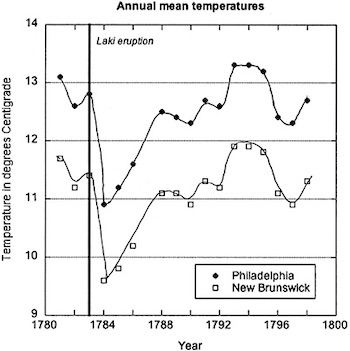


Volcanic eruptions can affect the climate, and large eruptions are sometimes followed by significant drops in temperature over large regions of the Earth for several years after the event.
These temperature drops can be seen at specific locations, such as shown in the graph here for Philadelphia and New Brunswick during the period 1780 to 1800.
But in many cases, the temperature decreases are truly global and are also reflected in global mean temperature decreases of several degrees.
All of the historic eruptions listed in the table below resulted in significant global cooling in the years following the eruptions. Also shown is the estimated sulfur discharge from each eruption. [*Logarithm of the sulfur discharge (kg)].
| Eruption | Year | Sulfur Discharge (kg) | Log Sulfur Discharge (kg)* | Global Annual Temperature Change (°C) |
|---|---|---|---|---|
| Agung (Indonesia) | 1963 | 9.3 x 10⁸ | 8.97 | -0.3 |
| Laki (Iceland) | 1783 | you calculate | you calculate | -1.0 |
| Krakatau (Indonesia) | 1883 | 9.6 x 10⁸ | 8.98 | -0.3 |
| Tambora (Indonesia) | 1815 | 1.7 x 10¹⁰ | 10.23 | -0.7 |
| Mt. St. Helens (USA) | 1980 | 2.6 x 10⁷ | 7.41 | -0.1 |
| Mt. Pinatubo (Philippines) | 1991 | 1.0 x 10¹⁰ | 10.0 | -0.6 |

In your field notebook, make a plot of temperature change versus sulfur discharge for the six eruptions in the table and examine whether there is a significant relationship between these two variables. Answer the questions in the notebook about the cooling effects of volcanic eruptions.
This concludes the virtual field trip to Iceland's Laki fissure. Thanks for participating! If you have questions or feedback, please use the contact information provided below.